Forecasting lies at the heart of many business decisions – from heat demand management to solar and wind power generation, and electricity load planning. Accurately measuring forecast quality is crucial. While the Mean Absolute Percentage Error (MAPE) is a popular metric, it has its peculiarities that one should be aware of. At alitiq, we rely on a deep understanding to select the best tools for your forecasting tasks. Let’s dive into the world of MAPE together and discover when he shines and when we have better alternatives at hand!
MAPE: The Seemingly Uncomplicated Friend
The MAPE formula is quickly explained:
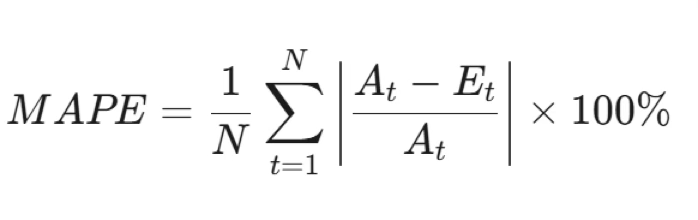
Here, Et is the estimated/predicted value at time t, At is the actual/observed value at time t, and N is the number of time steps.
Strengths: Thumbs Up for Understandability and Comparability!
- Easy to Interpret: If your forecast for the monthly heat demand of a district shows a MAPE of 5% over the last 12 months, you immediately know: your forecasts were off by 5% on average. That’s a clear statement!
- Scale-Independent: Whether you’re forecasting the output of a solar park or the electricity consumption of an industrial facility, MAPE allows comparisons across completely different datasets because he provides a percentage error.
The Downsides of MAPE: Where the Sun Doesn’t Shine
As charming as MAPE might be, he also has his drawbacks. And if left unaddressed, these can lead to poor decisions.
1. Caution with Small Values and Outliers!
MAPE can inflate dramatically due to very small actual values or extreme outliers. Imagine the actual wind power production of a wind farm drops to 10 kW due to calm winds, and your forecast was 20 kW. Already, the Absolute Percentage Error (APE) can be 100%. If the value even drops to 0 kW, the APE can approach infinity, even if your forecast was only a few kW. He’s like a tiny speck that suddenly dominates the entire picture!
2. When Zeros Become a Problem: Intermittent Values
Data with periods of zero values are an absolute no-go for MAPE. If At (the actual value) is zero – for example, when a solar array generates no energy at night or an electricity meter measures no load – division by zero becomes impossible, and MAPE becomes infinite or undefined. Therefore, MAPE is unsuitable for forecasting the generation of renewable energies or load during very low consumption periods.
3. The Asymmetry: Over- versus Under-Predictions
MAPE isn’t fair. An over-prediction of electricity demand can lead to a significantly higher MAPE value than an equally sized under-prediction. This is because At (the actual value) is in the denominator of the error term. If you, for instance, over-predict demand by 10 MW, the percentage error might appear smaller if the actual demand was 1000 MW. However, if you under-predict by only 10 MW when the actual demand was 100 MW, the error has a proportionally larger impact. This can lead forecasting systems to tend towards under-predicting to minimize the MAPE value – which in the energy industry can lead to bottlenecks or unexpected procurement costs, for example.
4. The Missing Direction: Which Way Are We Headed?
MAPE doesn’t tell you whether you tend to over-predict or under-predict. However, in power plant scheduling or electricity trading, it’s often crucial to know whether you will have too much or too little capacity available. MAPE remains silent here.
Alternatives to MAPE: When More Precision Is Needed
Don’t worry, we won’t leave you in the dark! When MAPE reaches his limits, there are other robust metrics that we at alitiq gladly employ:
- RMSE (Root Mean Squared Error): Measures the average difference between predicted and actual values. Mathematically, he’s the standard deviation of the residuals. Robust and widely used, but not scale-independent. In wind power generation, for instance, RMSE can indicate the average power error in kW.
- WAPE (Weighted Absolute Percentage Error): The sum of absolute errors divided by the sum of actual values. Like MAPE, he’s scale-free, but he doesn’t get inflated by small values. An excellent alternative that bypasses many of MAPE’s issues! Particularly useful when you want to evaluate the total energy output over a longer period.
- MdAPE (Median Absolute Percentage Error): Significantly more robust to outliers than MAPE, as it uses the median instead of the mean. This helps to better evaluate extremely rare but large errors in load forecasting during major events without distorting the overall picture.
- MASE (Mean Absolute Scaled Error): Scales forecast errors by the in-sample, one-step-ahead MAE of the Naïve method. Ideal for intermittent values but less intuitive. Useful when you need to assess the quality of your forecast for a battery storage system that is irregularly charged and discharged.
- sMAE (Scaled MAE): Uses the mean of the in-sample actual values as the scaling factor. More intuitive than MASE, but problematic for non-stationary data.
Practical Implications: Don’t Optimize Blindly!
Blindly optimizing for MAPE can lead to sub-optimal forecasts. For us at alitiq, this means: We analyze the peculiarities of your data – for example, the volatility of solar production or the seasonality of heat load – and the specific requirements of your industry to select the appropriate metric for forecast accuracy. In many scenarios where MAPE reaches his limits, WAPE is an excellent, scale-free alternative that retains many of MAPE’s strengths while circumventing his disadvantages.
Conclusion: MAPE – A Good Tool, But Not for Every Task
- Intuitive and Comparable: MAPE is easy to understand and allows comparisons across different datasets.
- Handling Trade-offs: For trade-offs between over-prediction and under-prediction, MAPE can be split into components to gain more insights.
- Caution with Outliers and Zeros: MAPE is not suitable for data with low or intermittent values, especially in the energy industry with zero loads or injections.
- Asymmetry in Predictions: The asymmetry of MAPE can lead to conservative forecasts, as over-predictions are penalized more severely.
- Alternatives Exist: WAPE is often a better choice when MAPE’s limitations come into play.
Choosing the right metric is crucial for the success of your forecasting models. At alitiq, we support you in finding the optimal strategy for your specific challenges. Because at the end of the day, it’s not just about the forecast, but also about the correct evaluation of its quality!