New alitiq API Portal: Onboarding PV Systems and Wind Parks
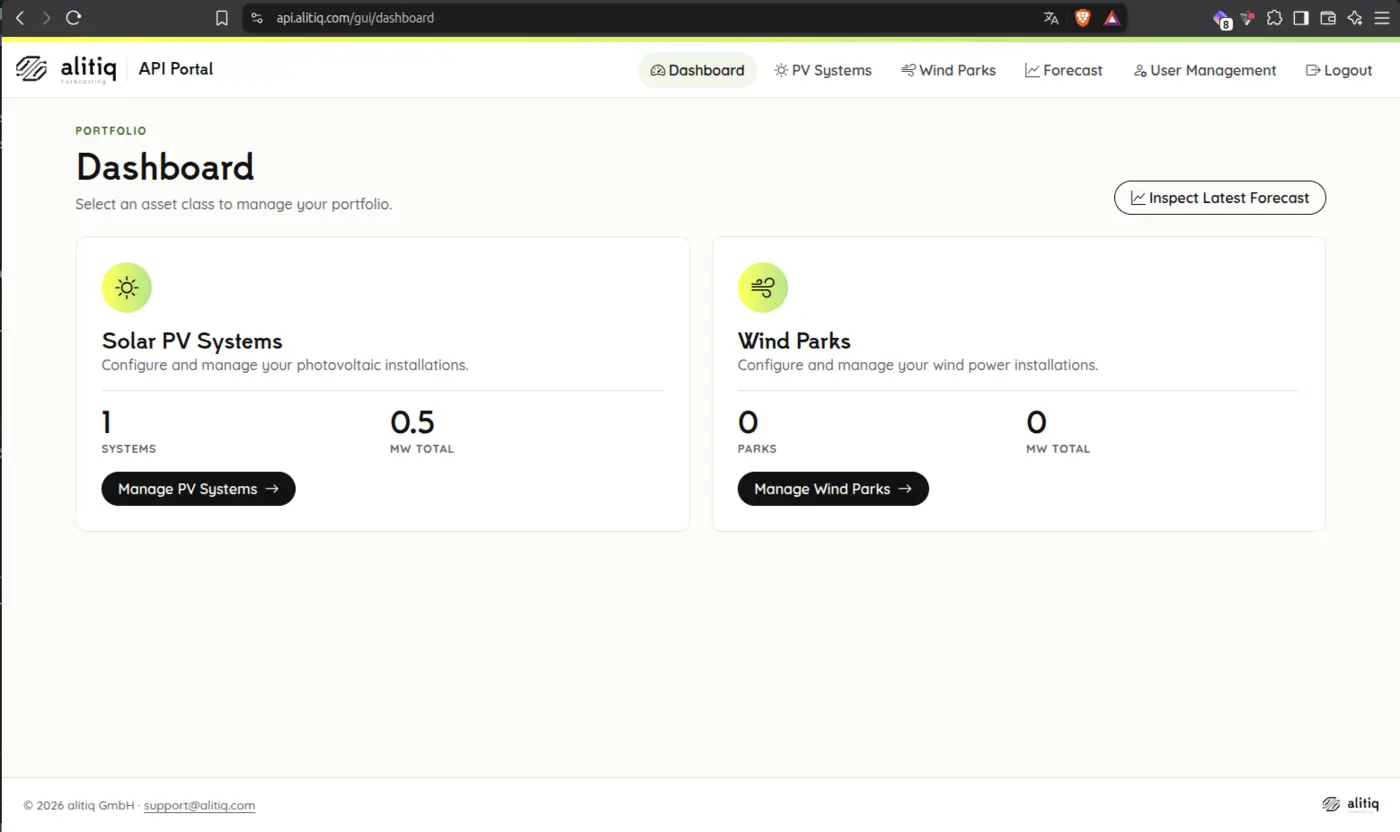
The dashboard of the alitiq API Portal
With our latest update, the alitiq API Portal has a new look and a clearer workflow. If you receive our forecasts via the API, the portal is where you set up and manage your portfolio – without writing a single line of code.
What Is the API Portal For?
Our PV forecasts and wind power forecasts are delivered via the alitiq API. Before we can calculate a forecast, we need to know your assets: where they are, how they are built and how much capacity they have. You can send this information via API calls – or enter it in the API Portal at api.alitiq.com/gui, with forms, maps and a preview of your forecast.
The portal is aimed at everyone who works with our forecasts: direct marketers, utilities and plant operators who want to add new assets quickly, check their data and integrate the forecast into their own systems.
What's New
- New design: the portal now follows the alitiq corporate design – the same look as our website.
- Clearer workflow: every page guides you step by step, from the location on the map to the technical configuration.
- Better forecast preview: the forecast inspection shows the latest forecast as a clear, interactive chart.
The dashboard is your starting point. It shows how many PV systems and wind parks are in your portfolio and how much capacity they add up to, and takes you straight to your assets or to the latest forecast.
Onboarding a PV System
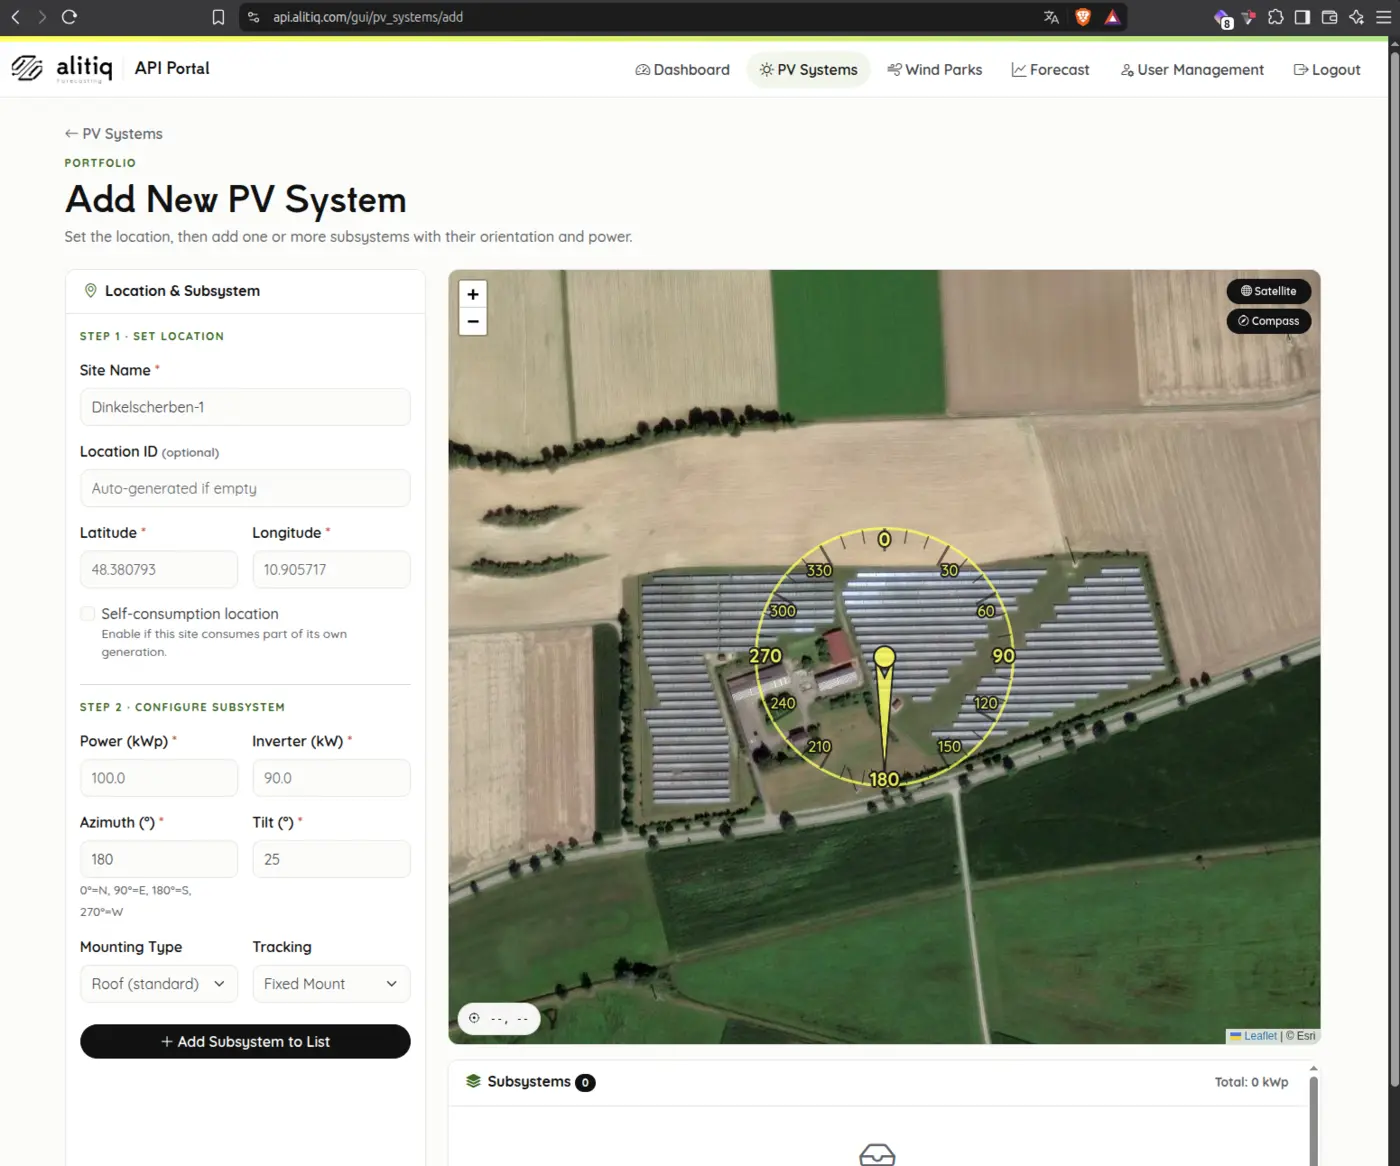
- Set the location: click on the map or enter the coordinates. The satellite view shows the actual plant, so you can see right away whether the location is correct.
- Configure the subsystem: enter peak power (kWp), inverter power (kW), azimuth and tilt. The compass on the map shows the orientation directly over the module rows – a quick plausibility check for the azimuth.
- Mounting and tracking: choose between roof (standard or well ventilated), free-standing, bifacial or facade/BIPV, and between fixed mount, single-axis and dual-axis tracking.
Plants with module fields facing different directions simply consist of several subsystems. Sites that consume part of their own generation can be marked as self-consumption locations.
In the PV system list you can also see for each system whether measurement data is available – the basis for forecasts that are optimized with your measurements.
Onboarding a Wind Park
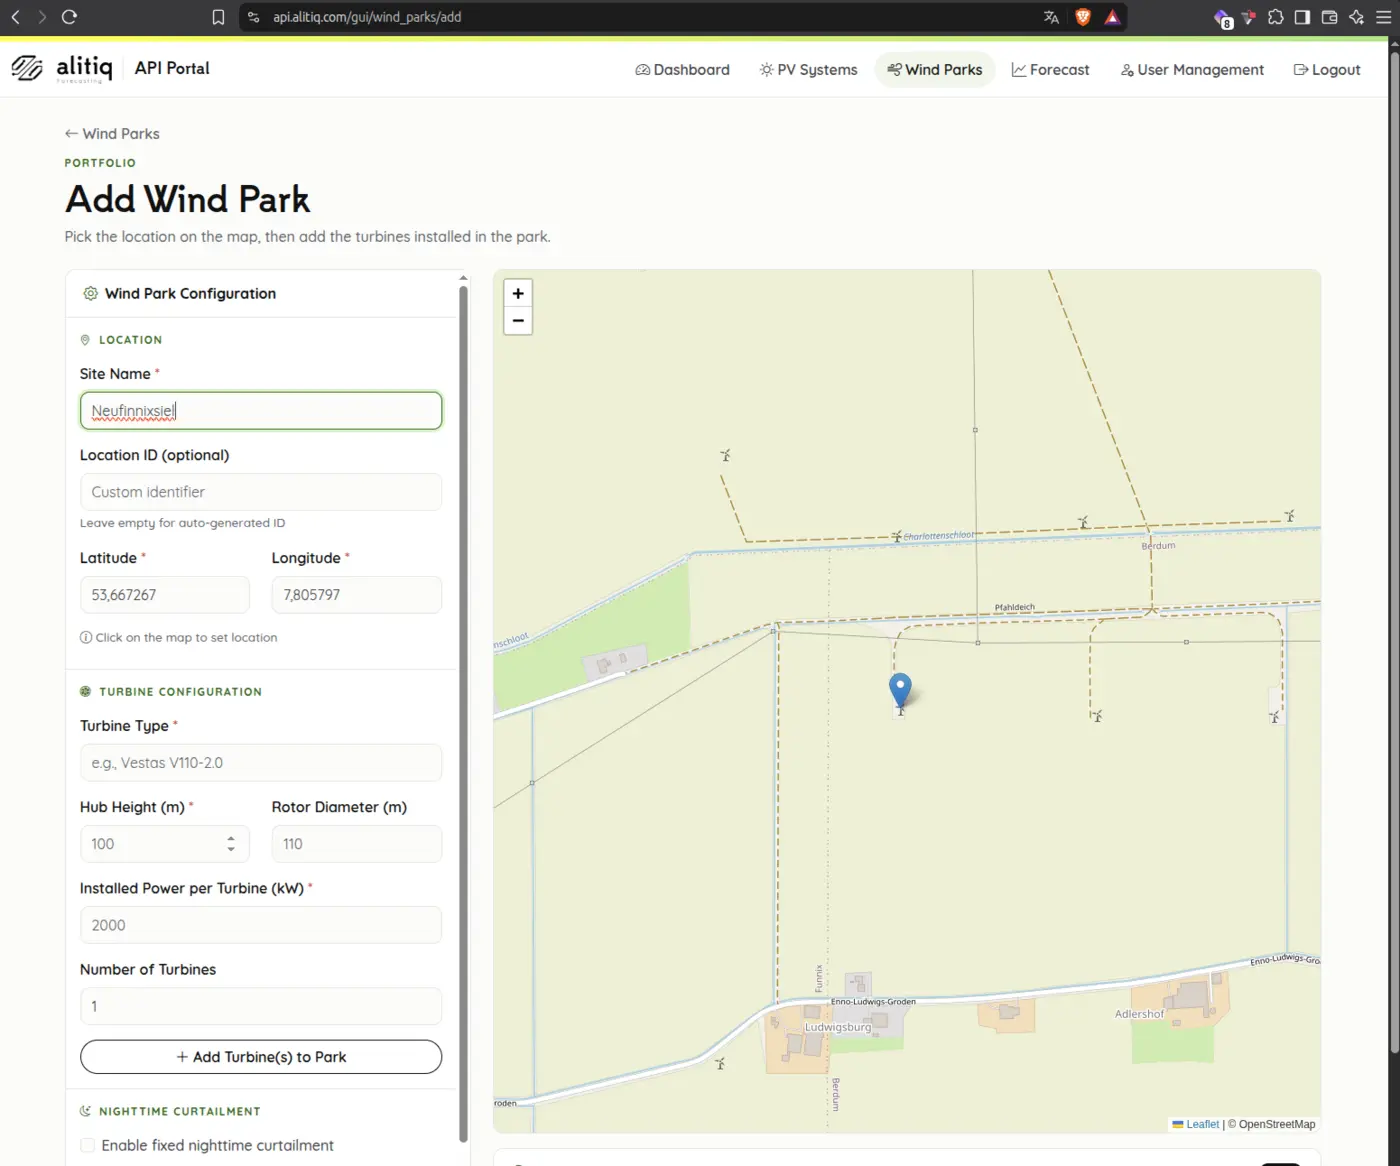
- Set the location: pick the location on the map. The map shows wind turbines from OpenStreetMap, so you can place the park exactly where it stands.
- Add turbines: choose the turbine type from a list of more than 190 models, then enter hub height, rotor diameter, installed power per turbine and the number of turbines. Parks with different turbine types are added type by type.
- Nighttime curtailment: if the park is curtailed at night, for example for noise protection, enter start and end time, curtailment level and time zone. They are stored with the park.
Checking the Forecast and Generating the API Request
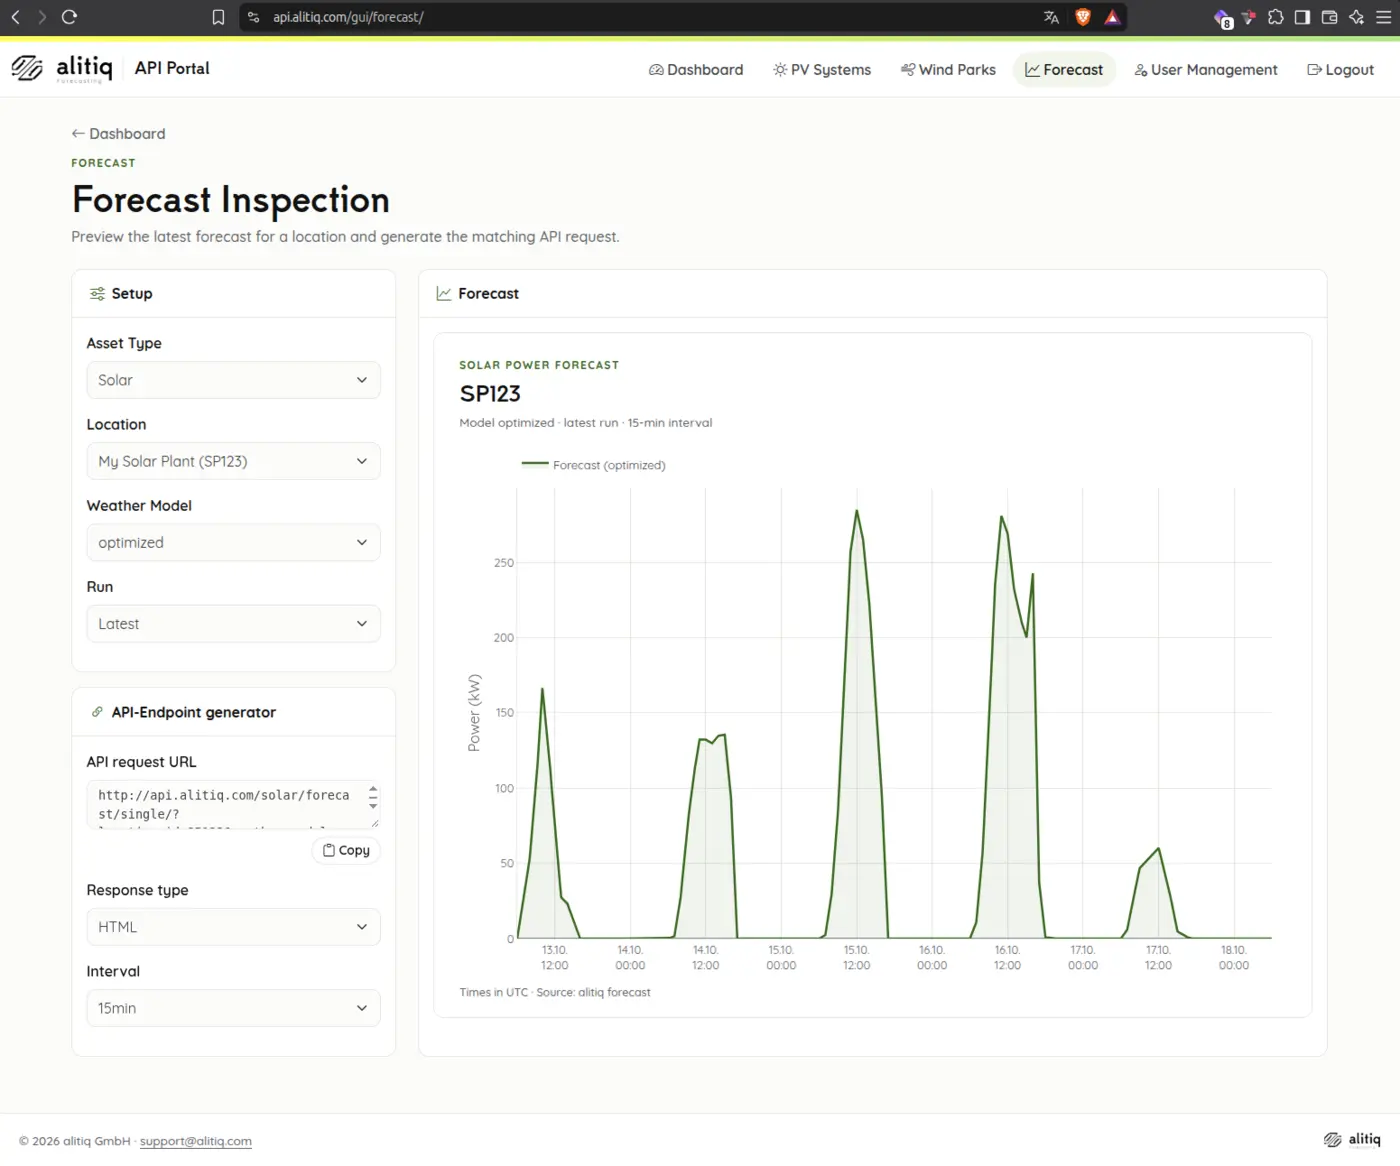
In the forecast inspection, choose asset type, location, weather model and forecast run and look at the latest forecast right away. The API endpoint generator builds the matching request URL – as JSON, CSV or HTML and in 15, 30 or 60 minute intervals. Copy it into your own system, script or spreadsheet, and the forecast flows into your processes.
Secure Access
In the user management you manage your API token, including its expiry date, and protect your account with two-factor authentication.
Get Started
Existing customers log in at api.alitiq.com/gui with their alitiq account. The API documentation explains all endpoints in detail.
New to alitiq? Get in touch and test our forecasts with your own PV systems and wind parks.
Ready to Transform Your Business?
Discover how alitiq's forecasting intelligence can optimize your operations.
Contact Us